Share


Since we launched Illuminate back in May, our team has been working around the clock to develop even more features to help optimization teams better organize experiments, report performance and maximize impact. Today, we’re excited to share a few of these with you.
What’s new in Illuminate?
Show impact and determine priority
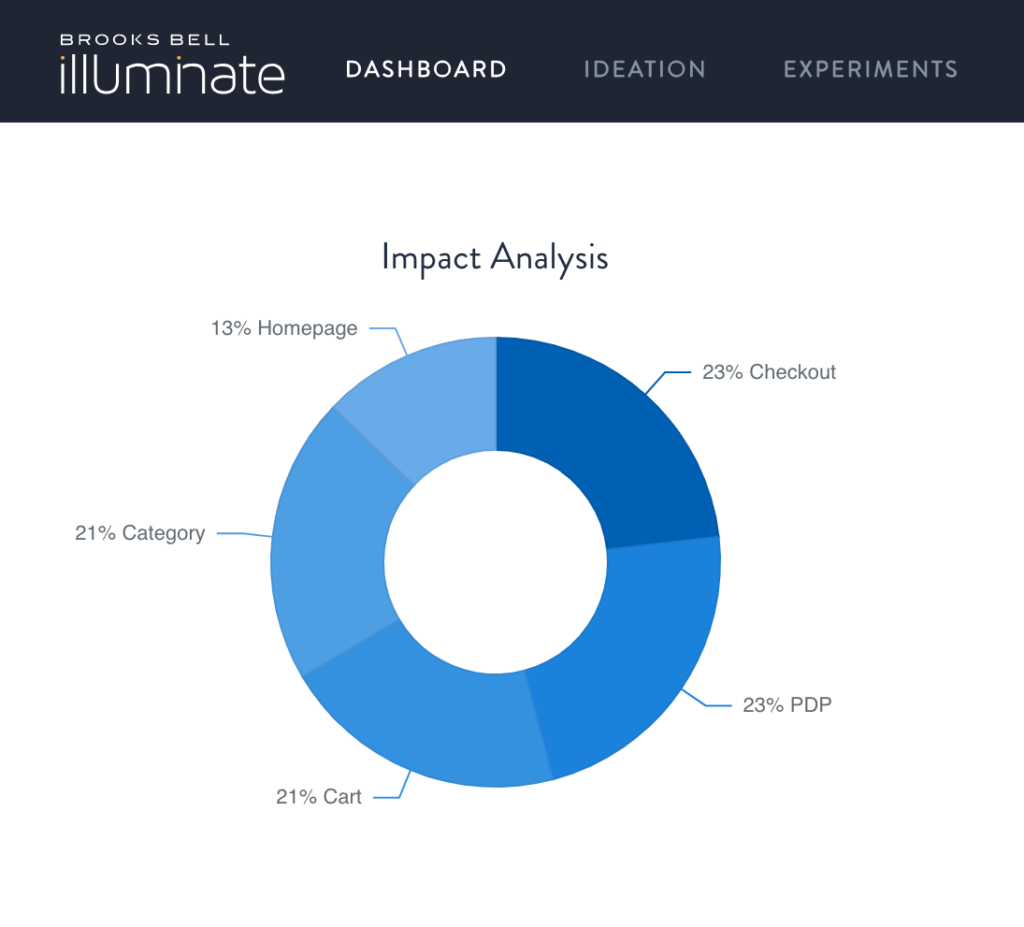
Use our new Impact Analysis to show the overall impact of your tests by page type and identify where you should be focusing your testing efforts.
Sort and filter by what matters most
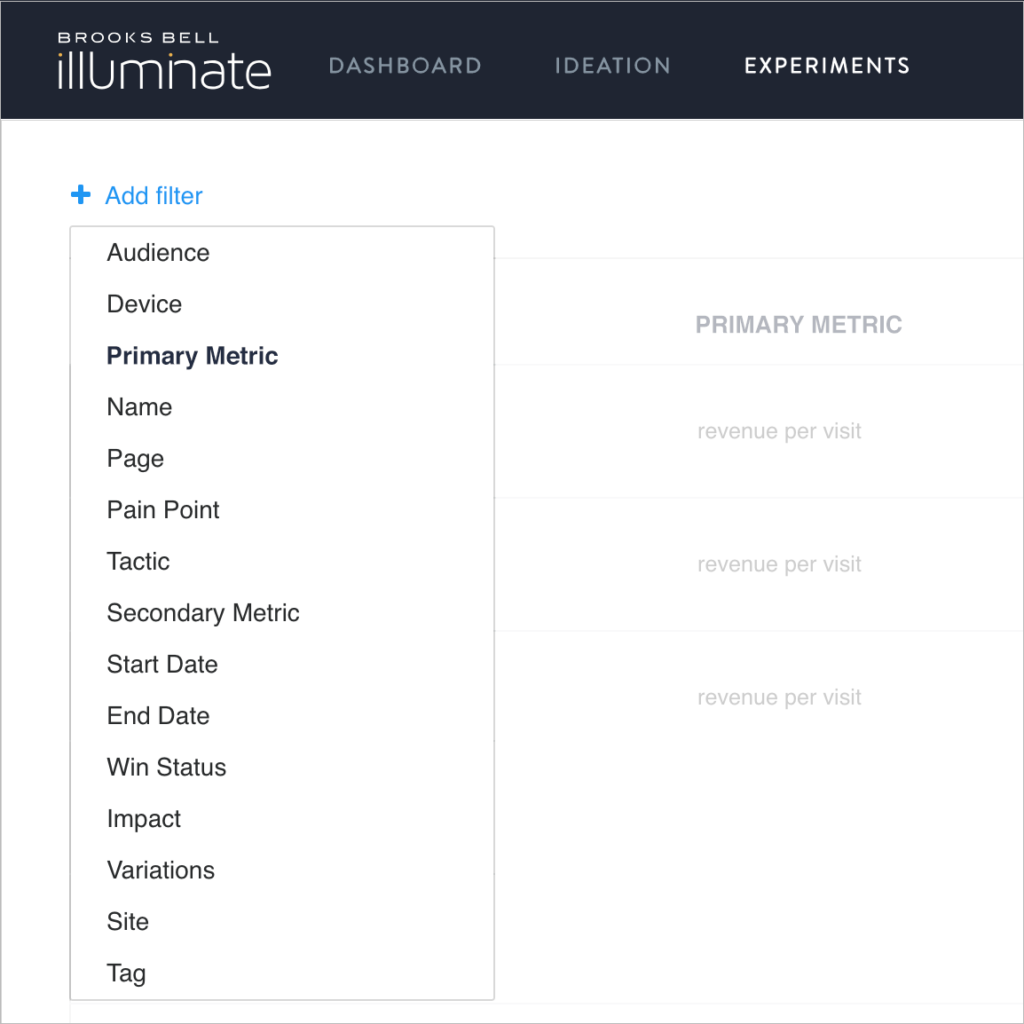
Filter your tests by 15 attributes including target audience, page type, start and end date, KPIs, revenue impact and more. Not seeing what you need? Add your own using our new custom tagging feature.
Keep sight of the bigger picture
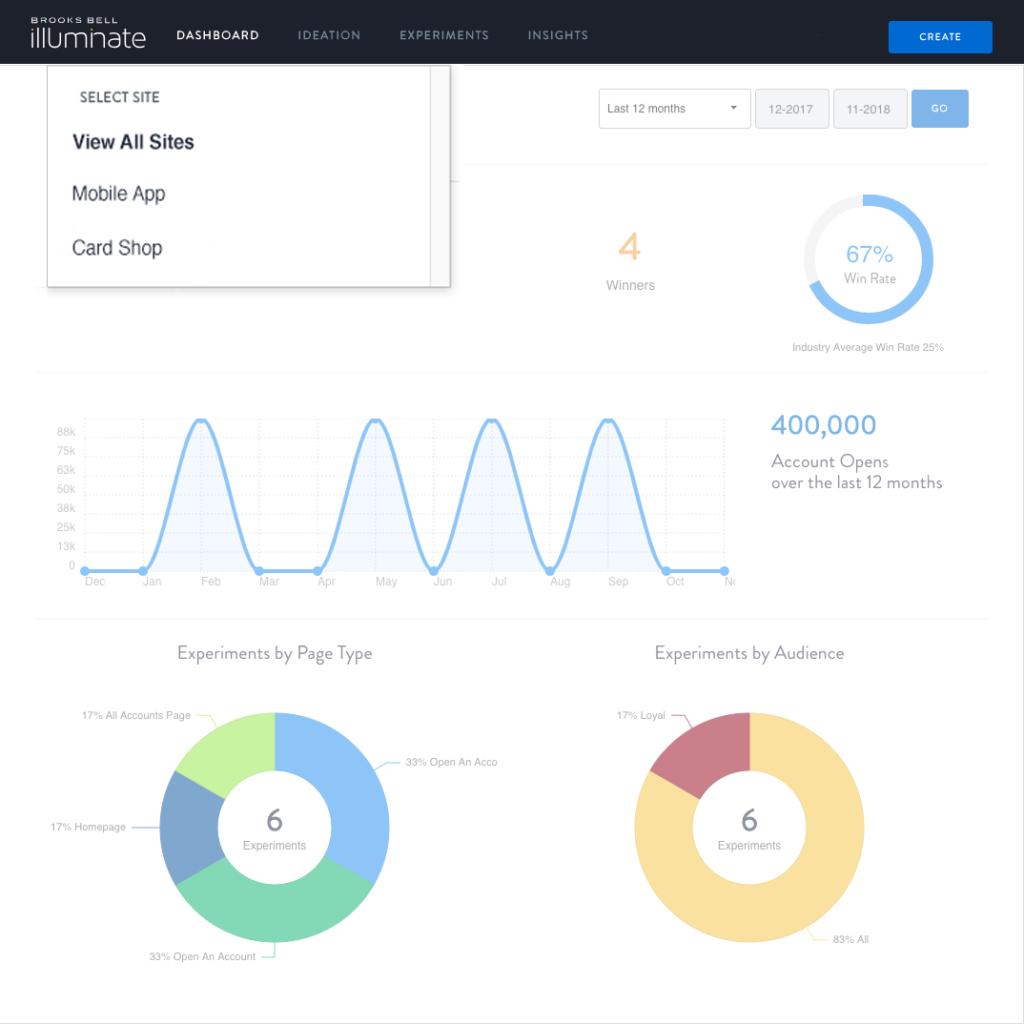
Our new dashboard view enables you to view your program’s overall performance or view performance by a specific team or line of business.
+ a new tiled layout
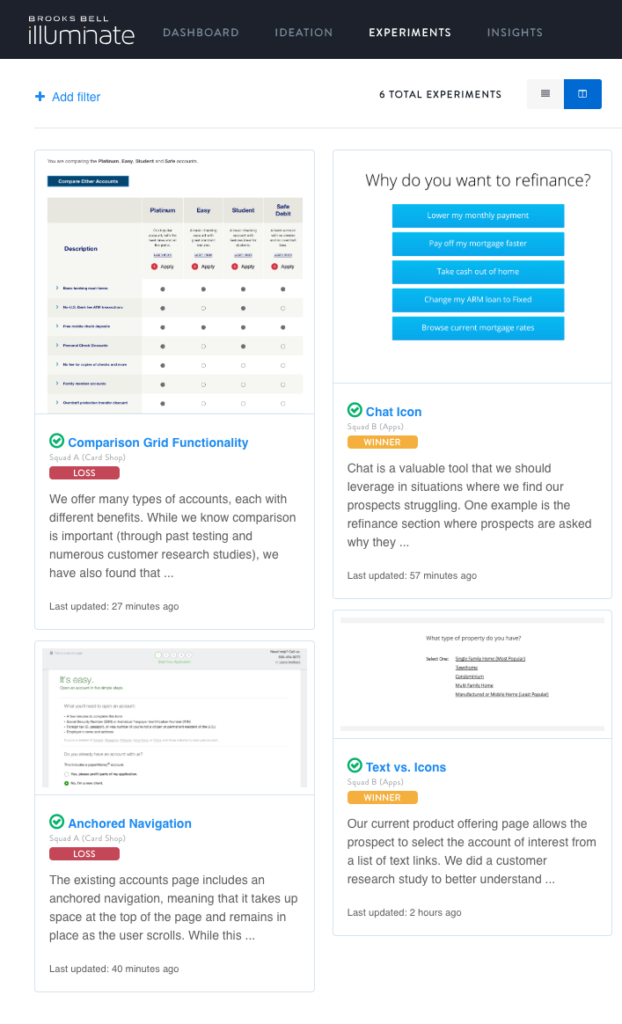
If you love a good masonry layout (á la Pinterest), then you’re going to love our updated experiment view. Easily switch between a basic list of your experiments or a super slick-looking tiled layout.
Many of these features were developed in response to feedback from our beta users, bringing more of Brooks Bell’s advanced experimentation methodologies directly into the software.

Interested in learning more about illuminate? Learn more on our website or schedule a demo using the form below.
Related Resources
Dynamic Research Integration: Unleashing the True Power of Insights

December 14, 2023
Why EX is Just as Important as CX: A Focus on Employee Experience

November 9, 2023
AI and Your Team: People, Process, and Governance

August 15, 2023

The Tool is Just the Beginning: Solving People, Process, and Governance Challenges Before they Start

May 24, 2023
The value of getting personalization right

January 31, 2023
