

Share


“It would be nice if all the data which sociologists require could be enumerated,” sociologist William Bruce Cameron wrote in 1963, “because then we could run them through IBM machines and draw charts as economists do.” Since then, the Internet has made measuring actual behavior easier than most imagined could be possible. This data has fundamentally changed marketing, retail, and service industries—and it has created a new class of professionals focused on making sense of a constantly growing set of measurements. The shift is important—especially in the context of business—in that it has enabled data-driven strategies and accurate measures of performance.
If you manage a testing and optimization program, you no doubt have ready access to quantitative data from both analytics and testing platforms. Sometimes, however, it may be necessary to integrate qualitative data. ![]() Maybe you’re trying to solve a stubborn problem that testing alone hasn’t fully solved. Maybe you’ve had a huge win and want a better understanding of why the variation was so effective. Or maybe—and this is often the case—there’s a mandate from another department to make use of their costly focus group data. Fortunately, qualitative data works very well with the numbers flowing out of testing and analytics tools. To make the two approaches work together, however, we must first understand how they’re different.
Maybe you’re trying to solve a stubborn problem that testing alone hasn’t fully solved. Maybe you’ve had a huge win and want a better understanding of why the variation was so effective. Or maybe—and this is often the case—there’s a mandate from another department to make use of their costly focus group data. Fortunately, qualitative data works very well with the numbers flowing out of testing and analytics tools. To make the two approaches work together, however, we must first understand how they’re different.
How are the Approaches Different?
Put simply, quantitative data includes everything that can be counted and is best suited to answering questions about “what,” “where,” and “when.” Qualitative data is descriptive, can’t be counted directly, and is best suited to answering questions about “why.” Some more differences are highlighted in this table:
| Quantitative | Qualitative |
| Methods include surveys, financial records, web analytics reports, and testing results. | Methods include focus groups, unstructured interviews, and usability studies. |
| Begins with a theory or hypothesis that is then confirmed or repudiated by observations. | Begins with observations, develops patterns, then moves toward theory. |
| Collects broad data from many cases. | Collects in-depth information from relatively few cases. |
| Response options are fixed. | Responses are unstructured. |
| Analysis involves the use of statistical methods. | Analysis includes the development of codes, summaries, and themes. |
| Results can be generalized. | Results cannot be generalized. |
Looking at this table, it can be hard to see how the two types of data can be combined. Indeed, while they are fundamentally different quantitative and qualitative data share an important relationship with one another and, when integrated properly, can make each other more useful.
Bringing Both Methods Into Harmony
Perhaps the most obvious way to make the two approaches work together is through the use of a sequential-triangulated design. This process is sequential in that one method follows the other. It’s triangulated because the two approaches work to confirm the results.
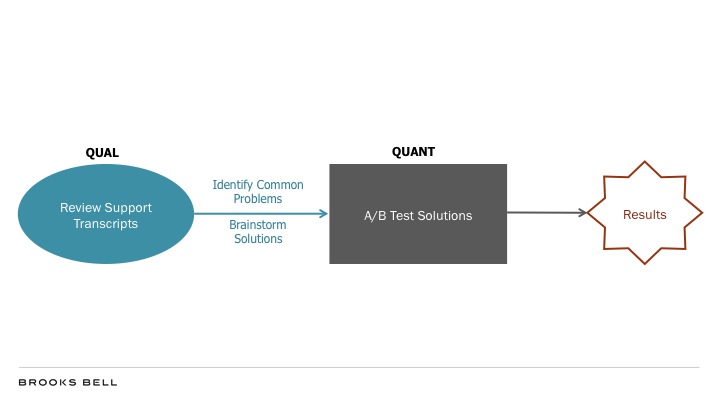
Reviewing a set of customer support transcripts looking for common problems, for example, would create a qualitative data set. These themes could then be used in a brainstorming session focused on developing solutions. These solutions could subsequently be tested and measured quantitatively through a testing platform. The result is informed by a qualitative, “voice of customer,” analysis and the solutions are supported by concrete, quantitative data.
Working With Other Departments
Often, different departments manage testing, usability research, consumer insights, customer support, and other sources of important optimization data. When this is the case, it can be hard to coordinate sequential processes like the one described above. Such situations may call for the use of a concurrent model.
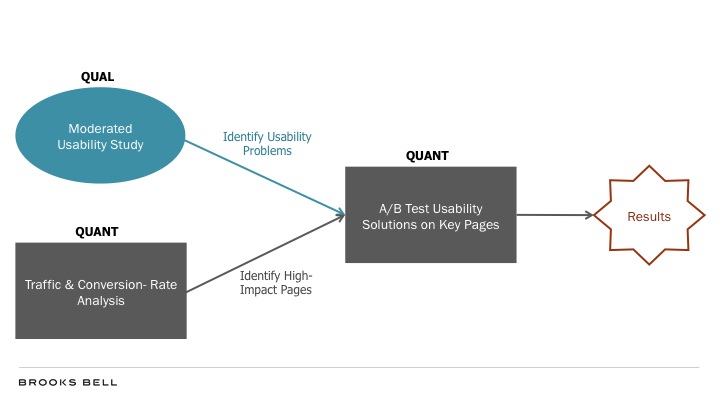
While a testing team performs a traffic and conversion-rate analysis on site to prioritize efforts, for example, a design team may conduct usability studies in an onsite lab. Though the two efforts occur independently and at the same time, the findings can be combined to inform a test of possible solutions on the highest-impact pages.
Developing a Mixed-Methods Testing Cycle
By combining both methodological approaches into a continuous cycle can drive a cross-organization testing program through prioritization, ideation, evaluation, and analysis. Achieving such a model can be time and resource intensive, but it provides a powerful foundation for developing a deep understanding of the consumer.
 A business insights team, for example, could perform a full-site clickstream analysis to identify the most significant drop-off points in a conversion funnel. These pages would be prioritized for a moderated, onsite usability study. The problems identified in this qualitative study would then inform solutions that would be simultaneously evaluated as variations in an A/B test and assessed through an online, remote panel study using a service like UserTesting. The results of both the test and panel study could then be used to produce an insight into both what customers responded to (quantitative) and why they responded (qualitative) the way they did.
Technology allows us to capture a wealth of data—both qualitative and quantitative in nature—and it makes sense to use as much of this information as possible when performing an analysis. In doing so, we can come to appreciate William Bruce Cameron’s sentiment that “not everything that can be counted counts, and not everything that counts can be counted”—and profit from it too.
Categories
Related Resources
Has Wayfair Solved Omnichannel?

May 24, 2024
How to Kill A Silo

March 6, 2024
What is an insight?

February 20, 2024
Demystifying Complexity: Workshop Facilitation for Organizational Growth and Alignment
November 16, 2023
AI’s Lustrous Promise: A Double-Edged Sword?

September 6, 2023
