I recently attended Adobe Summit for the first time, and I picked up some things along the way I wanted to share with you. Ahead of the event, I was excited to learn more about the company’s suite of products and services and better understand how our clients use them. And looking back now, the event provided that – and more. The magnitude and sheer volume of information and activities was a bit overwhelming. But, having my team by my side made it manageable. Here are a few standout experiences:
The opening Keynote by Adobe’s CEO, Shantanu Narayen, set the tone for the event, highlighting the importance of delivering exceptional customer experiences in today’s digital world. It was followed by a range of other CEOs talking about their customer journeys and how Adobe helped them achieve their goals. But it wasn’t just how they each used technology that impressed me. Several highlighted the importance of their people, process and governance in driving success with the Adobe tools. It also was not lost on me how much psychology played into everything. For anyone who knows me knows I love understanding how behavior works, and to see how it was being used on me was fascinating. For example…it was interesting how quickly people will abandon a brand due to just one poor customer experience. It drives home how important it is to get it right the first time.
Initially, I had planned to attend sessions on my own, but quickly realized that having a partner in crime was necessary to gain real-time insights and ask questions. Teaming up with our Director of Strategic Growth, @Paige Gunther, made a massive difference in how much I was able to learn and retain. After sessions, we compared notes and shared thoughts on what we learned and if/how we wanted to bring our new-found learnings to practice. I’d highly recommend this approach.
As our sales leader, these sessions were particularly valuable to me as they underscored the importance of having the right people and processes in place to maximize the impact of the Adobe Suite. This is where Brooks Bell comes in. As a consultancy with deep experience in digital experiences and organizational transformation, Brooks Bell is uniquely positioned to help organizations leverage the power of Adobe to drive better results. Our expertise in building Centers of Excellence and insight-driven experimentation, coupled with our deep knowledge of Adobe makes us an ideal partner for organizations that want to take their digital experiences to the next level. In fact, we’ve had a strong partnership with Adobe for nearly 20 years.
This was also the first business trip with my CEO, @Greg Ng, and traveling with him was an unforgettable experience. I had the opportunity to witness firsthand how he cultivated and nourished relationships with his contacts. As a growing leader, this was valuable modeling that I will take with me throughout my career. At the same time, getting to attend Summit in just month two of beginning my role at Brooks Bell gave me the chance to immerse myself in the culture. What really blew me away was how much I understood about Adobe, and how my fresh perspective is going to be extremely valuable to the clients we serve.
Overall, Adobe Summit was exciting and a well-executed event that solidified existing relationships and formed new ones. I’ve attended several conferences, and this one is one of the more impactful because of the multitude of sessions and contacts that were there. I am already looking forward to next year’s event!
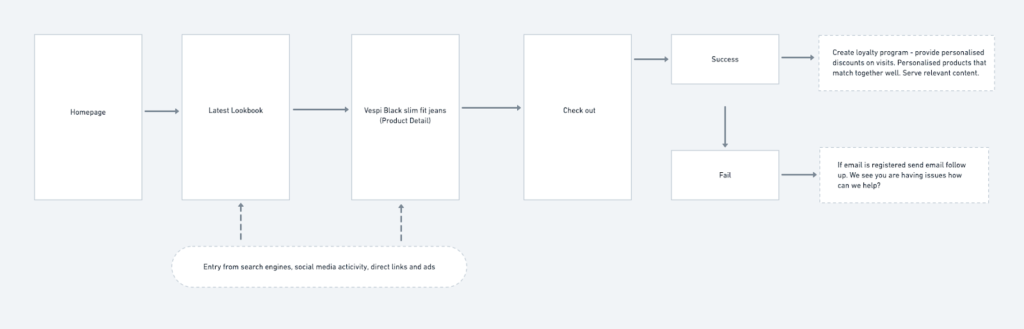
Today personalization has become a critical component of marketing strategies. Most firms I work with at Brooks Bell attempt to scale personalized experiences using marketing automation across email and social media, but this is rarely simple or straightforward. During a customer research study I conducted for one of our retail clients, we discovered that their communications came across as woefully insincere without personalization. Things like putting the customer’s name throughout the page or in every promotional email are not driving the value that customers expect and are an example of faux personalization. This type of personalization strategy slowly desensitizes the consumer to seeing their name and becomes increasingly ineffective. Automated personalization is not the answer to every personalization effort; it should propel you into manual personalization as you gain a deeper understanding of your customer’s needs, motivations, and anxieties. That deep understanding is how brands can create experiences that keep their customers coming back for more. When properly implemented, a personalization strategy can bring many benefits. Here are just a few:
Helps marketers understand customers
Through personalization, marketing teams can learn about clients’ present demands and potential future interests. Marketing teams need that connection to identify trends and acquire quick insights. Analyzing data collected from personalization efforts helps to inform new product development, evolve current offerings or decide when to discontinue a product.
Lets brands stand out
Think about brands like Amazon who tailor product recommendations based on your search and purchase record. Or those handy “frequently bought together” prompts, personalizing your homepage by ensuring the products you see reflect your likes, purchases, and real-time activities. This type of personalization helps speed up the sales process and contributes to a higher close rate by stopping you from flitting away to another, more personalized competitor.
Enables higher conversion rates
Delivering great content when your user wants and expects it helps create better growth and conversions. Sainsbury’s, one of the most well-liked supermarkets in Britain, introduced coupon-at-checkout technology to print targeted coupons on items people wished to purchase. The average customer purchase per item increased due to this highly personalized offer.
Creates higher brand loyalty
Few brands are better at engaging audiences and amplifying their core message than Nike. Their Nike loyalty scheme includes apps like Nikeid; Nike Run Club, and SNKRS, offering loyal customers gifts for birthdays and member anniversaries. Members of the program also have access to their own online Nike store, filled with merchandise Nike has selected for them based on their past purchases and engagement history. Nike’s strong brand loyalty results from the emotional bond it creates through personalization.
Builds trust
Data from their personalization strategy allowed Target’s marketing analyst to form a “pregnancy prediction” score, allowing them to determine which purchasing patterns indicated a customer was in the early expectant stages. This level of personalization is fascinating but also could admittedly backfire. Adding a personal touch fosters trust, and the best approach to gain the customer’s trust is through an ongoing continual relationship that companies must cultivate—showing them that you are aware of their needs without being intrusive. Brands must carefully consider the interests of their consumers to win their trust and grow a following of devoted customers who will keep coming back. Your personalization approach should always be straightforward and transparent; it makes everything run more smoothly.
Brands will only become more skilled at personalization, so if you want to compete, you should start thinking about it – and soon. I hope these five reasons to embrace personalization influence future campaigns and set about blazing a trail to create unforgettable experiences through the insights that you gain with personalization.
Developers and designers work hand in hand but, sometimes, we speak different languages. That’s why a designer friend and I decided to do a “skill trade” together. She offered constructive criticism on my current design process—and, as per her request, I gave her advice on how to more clearly communicate with us developers and to better understand limitations.
Building on our skill trade, I’ve developed some helpful tips from me, as a developer, for designers. The biggest point I want to emphasize is that designers and developers can better communicate about when some projects will take longer to build than others. Hence, the majority of my tips will help you determine what may take a long time and what projects may not.
The simple reality is that some products and features take longer than others, and it’s vital that we’re all working on the same timeline. We can achieve so much more together when we’re all on the same page.
1. Development times can vary immensely.
The most important tip in this list is that it’s not easy to be put on the spot and asked to share an estimated timeline for development projects. So, instead of expecting an exact date, ask developers to give an optimistic, realistic and pessimistic estimate. For example, a developer might think creating a blog could take as few as three days or as much as 20 days, but probably around six days. So allow them to tell you this. Allowing for a range gives developers more leeway to work, which can take the pressure off and promise better-quality results.
2. Seeing user flows are so incredibly helpful.
User flows are helpful for developers because we can refer to them to start architecting out the software solution. When we understand the intended outcome, we’re much less likely to miss the “essence” of the design. I know most designers create these already, so they can simply pass them over to their developers once they’re ready.
3. It’s important to know when information needs to be stored.
If we want to show a piece of information in the future, the designer should ask themselves whether or not that information will need to be stored. An example is the publish date of a blog post—we’ll need to store that date somewhere so we always know when it was published. The required development work probably triples around a feature like this, versus a static piece of text.
4. New products and features tend to take longer to build.
Designers may want to ask themselves, “Has this been built by our team before?” If the answer is no, generally speaking, the amount of time it takes to develop the product or feature will triple in comparison to the amount of time it takes to develop a product or feature that’s been built before. For example, if a designer is creating a chart that’s exactly like another chart used elsewhere on the site, it’s much simpler to develop that than an entirely different chart.
5. Some exclusive features can take more time to develop.
If a feature is accessible to anyone, it’s generally easier to develop than an exclusive feature that only some customers can use. For example, some features only viewable or available to “admins” like the use of a “delete” button will take, you guessed it, about three times as long to develop.
If you’re curious what my designer friend shared with me, here is the advice from her end of the skill trade.
1. Your design should be, in order of importance:
Useful
Usable
Beautiful
After all, a product that looks good but doesn’t solve a problem or isn’t usable doesn’t do anyone any good.
This “super quick and important” read was written primarily for product managers and touches on the importance of actually communicating with customers. It dives into the ways in which the most successful tech companies—Amazon, Google, Facebook, Netflix, and Tesla—design, develop and deploy such world-renowned products for billions of users.
3. Determine why this is important to solve before creating any mockup.
Figuring out why you need to design something should always come before figuring out how to design something.
Have any specific questions or tips of your own to share? Drop us a line!
In a world of online behavior becoming a heated debate for its ethicality of use, we wanted to share a more altruistic approach in what this data can be used for.
There are undoubtedly thousands of analyses done on predicting COVID hot spots – looking into a wide variety of factors. However, what if these factors could be aggregated into a select few criteria? We asked ourselves the question, “what is impacted by most everything?” Money habits. Spending behavior is likely driven by the same factors that influence someone’s confidence to head out into the world, step into a store or sit in a chair and make a purchase. Moreover, online behavior is made up of much more than just retail – travel and financial industries could be leading indicators of the previously known normality.
Does a spike in online travel bookings coincide with a COVID spike in a certain location?
Does an increase in online retail spending suggest that COVID may soon begin to subside in certain areas?
Does a user banking online suggest they are even too fearful to handle their investments face to face or have more time to take in content?
The point of this is different than most, and was originally not intended to be reactionary – to see what an online retailer might expect based on COVID cases. It was and is intended to be proactive – bringing together these disparate data sources, COVID reporting alongside traffic and conversion trends to attempt to predict where and when COVID is surging or subsiding. As you will see, the following analysis will contain opinions based on the data. These opinions may be controversial to some readers, but they were gleaned from the data and our industry experience.
Analysis
Aggregate Industry View
Using aggregated, anonymized Illuminate(R) data, we’re able to access and trend many different verticals. Joining this with COVID-19 data, both broken down by a state level, we can begin to see interesting trends. We used New Case volume as the indicator of COVID, but deaths were also reviewed and showed similar trends.
Looking at an aggregate conversion view, there are undoubtedly trends specific to travel, retail and financial services verticals.
Of note, there are three major time periods that show substantial increases in COVID cases – 1) the initial onset of the pandemic, 2) late June to early July 2020 and most recently 3) the end of September and into October 2020. These are all based on New Cases. Daily Deaths were also reviewed, and though the scale is much different – similar daily trends are evident. This is documented in many different available reports.
Travel:
The most obvious trend is that Travel took a substantial hit at the beginning of COVID. This has largely returned and stabilized, since mid-June. However, travel is still a bit lower than pre-COVID, and has oddly begun to fall again as we enter October 2020. Sure, there is some seasonality at play, but a closer look reveals that these declines occur at the exact same time as COVID spikes (though, notably not at the same scale). Since a large percentage of travel bookings occur just days before travel, our initial theory was that an increase in bookings would coincide with a COVID increase, perhaps days later.
We do notice that once travel began to gradually increase, there was an increase in confirmed COVID cases toward the tail end of the rise. However, the scale is just not the same, and our data indicates that there were far more quick booking to travel instances. Therefore, in this instance – it would seem that COVID impacts travel more than travel impacts COVID. This is not to say there is not an association, but at the aggregate level – the effect may be muted.
It is worth noting that traffic to travel sites saw a dramatic spike directly before the September 2020 COVID case increase, and declined suddenly thereafter. There is a potential that this was pure consumer interest, but only that – interest while COVID was on the decline.
Retail:
Purchasing behavior has shifted to become more online focused, and many sub-industries (apparel, electronics, etc.) within retail have seen massive gains in online shopping. However, others may have seen declines. Product offering plays a large part in this observed “feast or famine.” An aggregate of retail shows a gradual increase in online purchases that has generally maintained since the beginning months of COVID.
Generally, increases in online purchases have been shortly followed by COVID increases, but that is not always the case. During the first increase, retail conversion increases preceded COVID cases. Traffic was not largely impacted, so this was a pure conversion rate increase that was only seen during the first surge. While the reasoning for this is debatable, we feel a likely explanation is that customers were prepping for quarantine during this early phase, hence why retail increase slightly preceded the COVID spike. As we’ll discuss later, New York was the initial US hot spot, largely contributing to the first surge, and New York has its own special spending behavior.
The second COVID spike was not preceded with an online retail spike or decline. We do know that states began to relax restrictions, but there was not a drastic drop in retail shopping – to suggest that this could predict an approaching wave. The increase in online spending took a sharp increase right after this inflection, and is much more of a reactionary step.
Finally, the last and current increase in COVID is again preceded by an online retail spike (with the same wavelength as seen during the start of COVID). Oddly, this is the inverse of what Travel and Financial online conversion is seeing. Could this be pure seasonality (think Fall and Winter preparation) or is this connected with COVID? In actuality, it’s likely both. There are countless factors we could look at to try to better understand the user’s mindset. It again would appear that retail is more reactionary to COVID than an early predictor. However, it is worth noting that Travel and Retail completely differ in their reaction, which largely makes sense, but when the changes begin occurring at the same time – as in the 1st and 2nd COVID case spikes – they were followed days later by sharp COVID case increases. Is this connected? Perhaps, but nonetheless it’s interesting to note.
Financial:
Despite our expectation to see drastic differences, the use of online financial services has not substantially changed due to COVID and is likely not an indicator of new cases. Specifically, we consider a conversion for financial to range from an account application to content consumption. We would have expected much more account usage and time for exploring online content. However, this just does not seem to be a factor. Many of these items previously required an online presence and even though the market and economy have undoubtedly changed, FSIs are seemingly consistent and least impacted of the major online conversion driving verticals.
Conversion and Traffic Visuals:
Conversions
Traffic
Alternate View: Difference – [COVID New Cases] / [Industry Conversions]
State Level View
There are excellent daily views of COVID cases available, at the state level, so most should understand the key differences in trend. As to why these states differ, well that’s a lengthy debate that we won’t address. However, as has been stated – web behavior could help explain a bit about future COVID case volume. Below are a few plots of highly populated states, and states with either previous or recent COVID case surges.
For the most part, all states have seen similar trends in general web behavior. All took dramatic declines in traffic and conversion at the start of the pandemic, regardless of where their current case volume was. Of course there are outliers, like major urban areas like NYC. However, these cities have much different infrastructure and shopping behavior, even pre-COVID.
It’s notable that of all the states, New York’s web behavior was arguably least affected, but has also seen a relatively slower return to its current state. Looking at specific dates, phase re-openings are easily seen, as is the fall shopping season. It is difficult to assess any COVID impacts for NYC after the initial peak – as case volume is fortunately very low.
Aside from New York and similar states, there are others following different tracks. Texas, California, Florida and really most states have shown dramatic COVID peaks in late July, with declines thereafter. As we take out the potential noise other dis-similar states impart on trends – we do see e-commerce and travel bookings hit their COVID peak right before the COVID case peak, and then begin to decline right after this time. The difficult part is determining at what rate of increase or duration of increase warrants concern? There may be too much involved in each state’s policy to truly understand this, but it is nonetheless very interesting.
North Dakota has been reported as having high COVID cases in recent months. It’s web behavior has also been impacted by this. While many other states have seen e-commerce pick up and maintain starting in April, North Dakota and similar states slowed their e-commerce conversions around June. This, unfortunately was followed by drastic increases in new COVID cases. There are outside factors here, which have been in the news, but states with similar e-commerce patterns have all shown similar COVID case trends.
Could e-commerce affect COVID for specific states? Perhaps – it’s noticeable, but is this because we are biasing ourselves in looking for a trend? I’ll leave that to interpretation.
Though arguably inserting bias – there are states that demonstrate very similar trends, as noted previously. If we look at these, there is an interaction connection between Retail and Travel. As an example. Below is a plot of 13 states with similar trends as Texas, above. The x axis shows Retail conversions while the y axis is COVID case volume. The three potentially confusing lines are a ‘normal’ Travel bookings trend in the middle, with the higher and lower lines representing increased (+1 SD) and decreased (-1 SD) Travel bookings. The plot demonstrates that during periods of high travel and high ecommerce times – new COVID cases are at their maximum. One could counter this point by saying it seeks out a trend, and that’s valid. Regardless, certain states (the majority) do show very similar web behaviors and this behavior has a similar impact on COVID cases.
Takeaway
Can web behavior predict COVID-19 transmission? Our opinion is that, in certain cases, it appears so. There does seem to be a connection between web behavior and new COVID case volume. Specifically, large and quick increases in e-commerce is followed by peak COVID case reports. However, there are many other factors at play, as well. For example – being an extreme urban center will create too much noise in any correlation we may see with the impact of web behavior. Local policy, general public view, etc. will all impact volume. While this was and is known – the thought that this could all boil down to something detectable in web behavior is still a sound theory, but more factors would need to be brought in. It’s a project we’ll continue to investigate, with the goal of bringing these data sources together to better understand the link between online behaviors and COVID so that it can be used for good.
The Data
We’ve released this aggregated and anonymized data to everyone via Illuminate. There, you can see how your traffic and conversion trends compare with top industries or with COVID case reporting. If you have an illuminate account, just log in to access this information. If you don’t have an illuminate account, signup is simple and FREE forever. https://www.brooksbell.com/illuminate/
About the Data:
Information provided for educational purposes only.
Industry trends are an aggregation of similar sites within the specified vertical. Since the purpose of the visual is to display trends – the presented data is adjusted to visually align with COVID-19 data. All daily trends remain consistent with raw data.
Sources:
COVID-19 Data Repository by the Center for Systems Science and Engineering (CSSE) at Johns Hopkins University.
Traffic and conversion data is from illuminate/Brooks Bell.
At Brooks Bell, we believe establishing a curiosity-driven culture is critical for creating adaptable organizations. Just as important to the creation of these cultures is onboarding new employees into them. Where do we begin as we design onboarding programs for our client’s new employees? Exactly where we begin all strategic engagements: understanding the people at the heart of the challenge.
Whether our team is conducting training, stakeholder interviews, or creative workshops, we always design our agenda by considering what our audience may come into the room (virtual or physical) thinking, feeling, or questioning. When newly hired employees are stepping into their new positions, their thoughts may include:
What will my team expect of me?
What are my core responsibilities for this job?
What should my goals be, and who will help me set them?
What resources do I have available while I’m getting started?
What does it take to be successful in this role, on this team?
Where can I make a difference, and will I be empowered to do so?
In summary, new team members are filled with uncertainty and doubt in the beginning days and weeks of their tenure, and it’s the job of an onboarding program to incrementally replace those feelings with confidence and know-how.
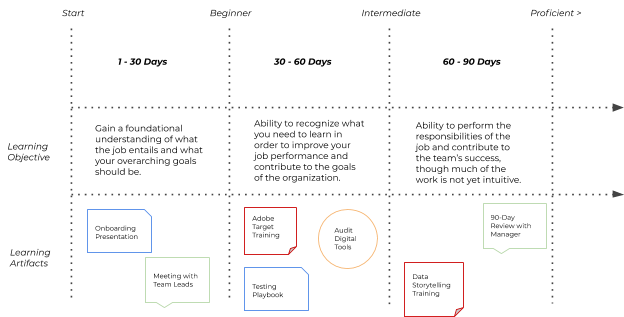
Many large organizations utilize a 30-60-90 day review process, so if your company does as well — even if it doesn’t — it might be helpful to use these dates as learning milestones to create an onboarding framework. Ask yourself what you’d like, or need, your new team member to achieve before each 30-day window is complete and what resources, meetings or activities need to be provided in order for them to do so successfully.
Maybe your framework begins to look something like this:
After establishing a rough framework we introduce our clients to the stages of learning, in which we move from having little awareness of what we don’t know (Unconscious Incompetence) to utilizing knowledge or a skill without having to actively think about what we’re doing (Unconscious Competence). Moving from one through to the other requires a thoughtful learning curriculum, much like a teacher would design for her class or hospitals for their residents. It should be no different, then, for new employees within your team.
The activity in designing an onboarding program centers around answering the following questions for yourself:
What is it that I want my team member to learn, when should that happen, and what is the best way to deliver that learning?
How will I know when they’ve done so successfully?
By answering these questions you’ll be able to start adding definition to your framework. You can add learning objectives for each 30-day period and begin to identify trainings, resources, meetings or activities, sequencing them in an order that best builds upon an employee’s existing knowledge and achieves the learning objectives you’ve set.
Your framework should begin to look a little something like this:
This curriculum view will also help identify resources, content or trainings you need but don’t yet exist, eg. Experimentation Playbooks, Data Interpretation and Storytelling Trainings, etc.
One last consideration to make with your onboarding curriculum is incorporating a continuous feedback loop. Not just one where the new employee receives feedback on their progress, but one in which the employees provide feedback on how successfully the onboarding program teaches the skills and expertise the role demands and prepares team members to make a positive impact within their department and across the organization.
We’ve been lucky enough to partner with our clients to design these onboarding programs for teams across organizations large to small, and even for ourselves. When employees join our team and realize there’s a structure in place, a plan that helps them move from doubt to confidence, those lingering questions and fears begin to dissipate and their contributions to their team and the organization in general soar.
Is your website built with the AngularJS framework? Do you write client-side A/B Tests? Here are some pointers.
Wait – it’s 2020 — isn’t AngularJS old at this point? Yes and no. The first release of AngularJS was over 9 years ago, and its developer, Google, released its successor, Angular (they dropped the JS!), a complete rewrite, in 2016. Google plans to maintain long-term support for AngularJS until mid-2021. Migrating from AngularJS to Angular or a popular library like React is no small feat, especially for a large e-commerce site, so a number of enterprises are still using the framework.
We’ll be talking about AngularJS (1.x), and not Angular (2+).
Tip #1: Take Advantage of Scope
If you’re a developer, you may be familiar with the concept of $scope in AngularJS, as well its Model-View-Controller architecture. At a high level, scope is an object that serves as the “middle-man” between the application Controller and the View, binding the two together. For client-side testing, using your application’s Scope can be very beneficial as it contains Model data that influence content on the page.
For example, you may wonder why a banner on your checkout page only appears at certain times, and just can’t figure out the logic. By digging into the element’s corresponding Angular data, you find that the banner’s presence is dependent on a specific user’s login state. If you know which Scope object and value to look for, you can account for when that banner will appear or not!
Accessing Scope
Since every site’s AngularJS implementation is likely going to be slightly different, the following may return “undefined” in your console, and therefore not work. There are a few options to try. So, open up your browser’s inspector tool and head to the Console.
One of the first to try is getting $rootScope, which will contain a lot of application data from where you can start to search for what you need:
Not having luck with the above? Try the following. If “undefined” or an error returns, try updating [ng-app] with “body”:
A lot of DOM Elements are bound to the data Model via Scope, and you may see an “ng-scope” attribute on those elements, or “ng-controller”. Those elements may have some useful data you can use!
Find an element’s selector in your browser inspector, (in this example, ‘.mainContainer), and see if you can access Scope directly from that node:
Note: On the Scope object, you may see a property named “vm”. This is a common convention and stands for “View Model”– and often contains a lot of the data tied to that Controller. If you don’t see a “vm”, try opening up “$$childHead” and dig through the object.
How else can this be useful? Well, on that Scope, you may see various named functions that can be used to replicate the default site’s functionality. Say your page has a menu with tabs, and you want the third tab open by default for your A/B test. You may find there’s a function in the Scope that you can call to do this for you.
Poke around and see what you can find!
Accounting for Page Changes
AngularJS applications differ from traditional sites in that pages are not reloaded on a URL change. AngularJS uses a service called $routeProvider to control page changes using HTML partials. Instead of redirecting the user to a brand new page, the application re-renders that same page’s markup with new content. This makes things speedy, but opens up challenges for Client-side A/B testing, as you need to make sure your campaign code runs at the appropriate time.
Protip: Use AngularJS’s $locationChangeStart to detect when a route (URL) change occurs, so you know when to run your test code. The parameter `next` that can be passed into the function refers to the new URL route the user accesses, so you can use that to determine the next “page” they’re on. Here’s an example:
More Tips and Tricks
For a more advanced method, inject content directly into the page using AngularJS’s $injector method so that you can tie into the existing $scope.
At Brooks Bell, for our clients using AngularJS, our in-house developers have written custom injection templates to make challenging development changes possible. We’ve got other tricks up our sleeves as well. Want our help or having trouble getting these tips to work on your site? Get in Touch.
We live in a world where data is currency. This isn’t news at this point, it just is. What we fail to acknowledge with that statement is the fact that currency is designed for transacting. Data, on the other hand, is designed for communicating.
At Brooks Bell, we generate a lot of data as we create, scale and evolve experimentation programs with and for our clients. But that data alone isn’t where the power resides — it’s how we use data to inform our decisions, our recommendations, and our discussions with each other and our clients. It’s how we craft a story integrated with data that positions measures and metrics as the ultimate starting point in any collaboration, both internal and external.
As a cross-functional team, we can review data following an experiment and determine a winning concept, but we’re also responsible for leveraging that data to understand what insight could be derived and how it may impact not just a single interaction within an experience but how it might create impact at scale for the rest of our client’s organization.
Data is both King and Queen, but their royal highnesses are still left rudderless without one’s ability to interpret and tell a story with that data.
This belief drives our effort to always pair quantitative research with qualitative studies. It’s fundamental to understand how customers have acted historically but it’s even more crucial to empathize with and project how they might act in the future.
When we start placing data within the axes of customer intention and business objectives we begin realizing the power of a data-driven organization. That value becomes amplified as we seek to design transformative experiences, identify new market opportunities, create new experimentation and learning curriculums, and most importantly as we work to build upon actions of our customers to uncover their nuanced motivations, intentions and unmet needs.
Being data driven is the starting point. Injecting data with story—filled with emotion and intention—with context and curiosity, is where this new currency really begins to prove its value. That’s the difference between data driven and customer centric. From understanding what’s happened to designing what’s to come.
The Americans with Disabilities Act (ADA) prohibits discrimination against individuals with disabilities. A disability in this context is a physical or mental impairment that limits one or more major life activities.
Title III of the ADA prohibits discrimination on the basis of disabillity in “places of public accommodation.” When the ADA was signed in 1990, the focus of Title III was the standards required for business’s physical locations in order to accommodate individuals with disabilities. The internet was not a large part of peoples’ lives at that point; accessibility of websites wasn’t even considered. However, as the internet has become more and more widespread, Title III is being interpreted to include websites as places of public accommodation.
ADA compliance for a website is tricky. You can’t just add a plugin that automatically makes your website ADA compliant – and there are disagreements in what even qualifies as full ADA compliance for a website.
The Department of Justice generally uses the Web Content Accessibility Guidelines (WCAG) as a guide to gauge whether a website is accessible. Websites should meet the guidelines for all Level A and AA requirements to be considered accessible.
However, even when following the WCAG, it may be difficult to discern if you’re actually meeting specific criteria or not – whether it’s because of the wording in the document or the ever-changing trends in website design and browser capabilities.
Why is ADA compliance for websites important?
If your website is found to be inaccessible to individuals with disabilities, you’re not in compliance with the law, which means you could face lawsuits.
There are other factors to consider as well. Many Americans have a disability of some sort that affects how they experience your website. This could be a visual impairment like colorblindness, or a hand injury that prevents the use of a mouse. They may have a neurological condition that makes reading a quickly rotating hero difficult or they may have an intellectual disability and need clear instructions in order to understand how to fill in the input fields on your website’s forms.
This segment of your users may be larger than you think, and if your website is not accessible to them, they will struggle to access or understand the information they need on your site—and may even turn to competitors with more accessible websites.
The overall goal of creating an accessible website is preventing barriers – to content and information, and limiting confusion and frustration. By striving to create an ADA-compliant and accessible website, you’re ultimately benefiting all users by ensuring your site is easy to understand and easy to navigate.
How ADA Compliance Factors Into Optimization
It can be easy to dismiss any A/B test code as simply temporary, and therefore doesn’t need to be ADA compliant. After all, it’s only running on your site for a short period of time.
However, consider the user who gets segmented into an inaccessible test variation.
This may be their first visit to your site, and if they can’t navigate the site in the variation they are segmented into, they may not return to your site.
This may be the visit in which a user was planning to make a large purchase, or they may need access to important information on the website—but because of an inaccessible A/B test, they are unable to navigate the site.
Regardless of how temporary your test may be, it is live code running on your site that users will be coming in contact with—and it should be functional for all users.
Things to keep in mind when creating accessiblemock-ups and writing code for A/B tests
Ideally, your team will follow all WCAG guidelines with every A/B test you build. However, in creating A/B tests there are accessibility issues that tend to crop up more than others. Here is our advice for designers and developers when building A/B tests.
For designers:
Use contrasting colors with a contrast ratio of at least 4.5:1 in your designs. This ensures text is readable against its background.
Ensure color is not the only means of communicating information. For example, an input field with an error that turns red will not be clear to somebody who is colorblind, and there may not be enough helpful information in the color change to convey what has happened, even for users who can see that the field has turned red. There should always be accompanying text explaining the error with suggestions on how the user can correct it.
Any new forms or input fields added for the test should be properly labeled so users know what to expect.
Avoid auto-playing audio and limit flashes. Ensure that any content that moves, blinks, or scrolls is able to be controlled by the user at a pace that is comfortable for them.
For Developers:
Include alt tags with clear, descriptive text on all images. This ensures screen readers can convey information about the image to users with visual impairments
Use proper markup techniques. This is easy to ignore with A/B tests where you may be moving around content or inserting content in new places. However, assistive technologies use markup to convey information on the page to users, so take the time to ensure heading tags are in a logical order and ordered and unordered lists are used appropriately.
Avoid adding images with text built into them. Instead, use a background image and add any text to it in the HTML.
Ensure all content is accessible with a keyboard. This is especially important to keep in mind (and easy to forget to do) when adding new modules, such as modals or input fields, onto a page for an A/B test. Ensure that you can tab through all the added content and that tabbing from any default content to the added content and back again happens in a logical way. Make sure that it is clear to users which element is in focus.
Keeping your website tests ADA compliant can feel overwhelming, especially if accessibility isn’t something your team has considered much in the past. However, the benefits—both to your company’s reputation and abidance of the law—and to your users, in having an easy to navigate the website, regardless of what test experiences they may find themselves in—make ADA compliance worth the time and effort.
For organizations large to small, “culture” has been top of mind for leaders who aspire to build a team that delivers consistent value to their industry and to the market. One that inspires employees to dream, make, and do, and follow the lead of the world’s most admired companies who are widely revered for their precedent-setting innovations.
At Brooks Bell, we know that designing an organization’s culture is central to shaping its continued success, not just in how team members work together but in their ability to think freely about possibilities yet to be uncovered. This is where establishing a culture of experimentation comes in.
A culture of experimentation means everyone across an organization—regardless of seniority—feels empowered to explore and execute new ideas. Team members in these types of organizations adopt a mindset of asking big questions and diligently uncovering their answers.
As customers engage with brands across an ever-increasing number of channels, success hinges on the brand’s ability to truly understand an audience and anticipate their needs across experiences. But, pinpointing which touchpoints across the customer journey requires experimentation and invention can be a challenge for any organization.
“Unless companies learn to challenge their current ways of thinking, they will not be able to survive. If a company is lucky enough to have a CEO who is visionary and can set the stage, it is easier for people to start exploring.”
Jerry Wind, Wharton School of Business, University of Pennsylvania
Although the process of experimentation seems straightforward, it is surprisingly hard in practice, forcing organizations to overcome process and technological challenges. That’s the overarching conclusion of HBR’s 40-plus years of collective experience conducting and studying business experiments at dozens of Fortune 500 organizations.
The key to beginning to identify opportunities for experimentation is to keep it simple. Begin iterating within insignificant moments of your customer experiences, always seeking to ease friction or emotional/mental burden for the customer, and doing so incrementally so you’re able to get a clear picture of what’s actually working and what isn’t. Once you’ve uncovered insights that transcend that moment in the experience, scale those learnings across your site, your department, and your global teams.
Creating a workplace culture that makes employees feel comfortable, collaborative, and safe is critical to any company’s success. But if part of your organization’s goals for the coming years is to create a lasting impact within and outside of your industry, establishing and celebrating a culture of experimentation is pivotal. A culture of experimentation allows teams to look beyond short-term recommendations and even further beyond challenging the status quo. Experimentation can and should be at the heart of core business decisions, product and research priorities, even employee engagement initiatives.
Staying true to starting simple, ask yourself (or your team) these simple questions:
What do you want to learn?
What do we want to better understand at a team, as a company?
What possibilities emerge once we have that understanding?
Launching an A/B test is not a matter of hitting go, and then putting your feet up while the data rolls in. Here are some things to incorporate to enhance your post-test launch process.
Whether you’re a seasoned experimenter or an entrepreneurial tester, launching an A/B test or any type of experiment is a major milestone in your testing cycle. After all those weeks of planning, strategizing, conceptualizing, developing, and QA-ing, you might feel ready to kick-back, relax, and watch your data accumulate as the test does its thing.
That might sound great, but there’s actually more that you should do after launching that can really enhance your experimentation program and take your testing to the next level.
Step 1: Post-Launch Validation
Many organizations deploy an A/B test QA process prior to launch but the post-launch QA is just as crucial. Why? There’s almost always a time gap between pre-launch QA and actual launch. That means there’s almost always a risk of a site update that could affect the test code. A post-launch QA process is a critical step to ensuring what you’ve launched is running as expected.
There are two moments post-launch where validation is critical.
The first is during the soft launch. With any test launch, it’s always a good idea to do a “soft-launch” where you only release the test to a certain portion of your website traffic. At Brooks Bell, we typically launch tests at 25% of the targeted level, meaning that if you were to release the test to 100% of your users, only a quarter of those users would actually receive the test experience. This reduces any risks of bugs (or even worse–a broken site experience!)
Metrics are the second thing you’ll want to monitor and validate during your soft-launch. In any test setup, it’s very common to set custom metrics to keep track of any new or existing elements that aren’t tagged on your site. During the soft launch, your analyst should check to make sure those metrics are firing as expected. This ensures that, come report time, they won’t be put in the embarrassing position to tell your team that a metric wasn’t tracked correctly.
During post-launch QA, it’s best practice to take screenshots of the control and the challenger experiences. If any issue arises during your testing period, you’ll have a record that the test code was clean when it launched, and therefore, you can point to a site update being the culprit behind the issue.
Another benefit of taking these screenshots – you now have images to communicate to your stakeholders that your test has launched. In any experimentation program, building momentum and awareness is key to success, and communication about a successful test launch is just one part of building trust with your organization.
Whether it be an email or a newsletter article or just a post within Slack, providing a brief description of the test along with the hypothesis and the screenshots will go a long way.
Step 3: Plan Ahead
As much as we’d like to sit back and relax after a test launch, many testing leaders simply don’t have that kind of luxury due to the high demand placed on experimentation programs these days.
In any type of experiment, experiment duration is always a limiting factor when it comes to helping you achieve your program goals. To make the most out of this time, you should use the next two weeks to update your testing roadmap with the latest timelines, plan out when you need to deliver the report for the test you just launched, and consider implications of a test winner and what your team should do about it.
Step 4: Celebrate!
Let’s not forget that launching a test is an accomplishment. It takes many hours of strategizing, planning, designing, and coding to make a test happen. And most likely, you didn’t do it all by yourself.
At Brooks Bell, we acknowledge a test launch by sounding the gong in our office and announcing on Slack for those who aren’t in the office.
In any organization, creating a strong testing culture fuels growth and as mentioned before, momentum and awareness is your key to success. Most organizations set their experimentation program goals based on how many tests they’ve launched in a year. So don’t be shy! Celebrate not only your wins but your test launches as well!