Share


A/B testing is most often used to evaluate a difference in proportions, such as through rate, order rate, etc. Another metric of interest is often the difference in revenue generated per visitor between a control and challenger. Evaluating revenue is generally seen as a test of differences between two means—and in most cases, this is more complicated than testing a difference in proportions. Traditional tests of means, called t-tests, require data to meet several assumptions to ensure they are statistically valid. In most cases, traditional t-tests, though widely used in the industry, are not the most appropriate method for evaluating differences in revenue per visitor.
Interested in data science? Don’t miss Improving the Reliability of Significance Testing Using Target Shuffling
The reason is simple: When testing the difference in revenue per visitor, the main assumption for t-tests is often violated. The problem is that the distribution of revenue per visitor rarely follows a normal distribution—a critical requirement for the use of a t-test. Most websites are disproportionally populated by visitors who do not order and thereby contribute a large percentage of zero values to the overall distribution of revenue per visitor. Also, and perhaps intuitively, revenue values have a lower bound of zero (orders can’t be made for less than zero dollars) but are unbounded above (visitors are usually unlimited in their potential expenditure). For these reasons, the distribution of revenue values is typically right-skewed, making t-tests a sub-optimal choice for evaluating differences in revenue between a control and challenger.
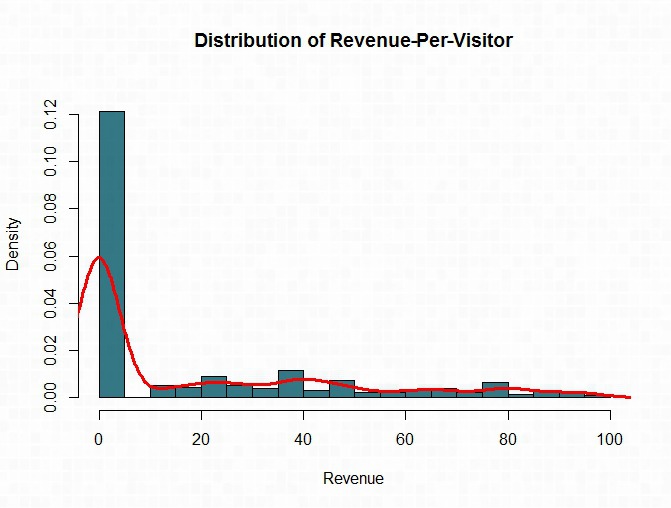
Depicted is a typical revenue per visitor distribution from a retail client. As you can see, the distribution of revenue is right-skewed with the vast amount of visitors not purchasing and the distribution tailing off towards the $100 dollar mark.
Typically a statistician would use a non-linear transformation to better meet the assumption of normality. While a non-linear transformation can normalize typical right-skewed data, it cannot normalize data with a large number of zero values. The most appropriate approach is to employ non-parametric techniques—techniques that do not rely on certain distributional assumptions—to test for differences in revenue. The non-parametric equivalent to the t-test is the Mann-Whitney-Wilcoxon test (MWW). This is a rank-based approach that takes all revenue values of a control and challenger, combines them into one vector and orders them, separating the vectors apart again and testing the difference of the ordered values. In this application, it can be argued that the MWW is effectively testing whether the control and challenger have similar distributions without relying on the pre-specified distributions required by t-tests.
Get your data in shape: Make Sense of Data Discrepancies Across Testing and Analytics Tools
When facing non-normality, the MWW can be the most appropriate technique and is often more statistically powerful than a t-test. In other words, in non-normal data, the MWW can have a higher probability of detecting a difference if a difference exists.
The goal of any testing campaign is to effectively determine if site modifications positively impact the metric of interest. If that metric of interest is revenue per visitor, you must employ more analytical rigor to detect true differences and to control error rates. To date, no testing tool has the off-the-shelf functionality to accurately apply the most appropriate statistical test based on the underlying distribution of your data. By having subject matter experts export and analyze the data themselves, your team can ensure that optimal decisions are made, ROI is maximized from your testing program, and wins and losses are reported accurately and effectively.
Brooks Bell helps consumer brands profit through conversion rate optimization, A/B testing, analytics and personalization.
We work with enterprise companies to more effectively leverage their data, create a better understanding of customer segments and build more relevant digital customer experiences. Learn more about our services.
Related Resources

How to Become an Insight-Driven Organization in 2024

April 10, 2024
The Pitfalls of Change Management

March 20, 2024
How to Kill A Silo

March 6, 2024
Dynamic Research Integration: Unleashing the True Power of Insights
December 14, 2023